bleties
IES retention analysis from PacBio CCS reads
MILRAA - Method of Identification by Long Read Alignment Anomalies
The MILRAA module predicts likely IES insertion/deletion coordinates from a mapping of long sequencing reads onto a reference genome assembly. The reads must first be aligned to the reference, which is assumed to be somatic (MAC) but possibly with some IESs retained in the assembly. The alignment is assumed to be accurate. The outputs are the coordinates of the predicted IES indel positions, and IES consensus sequences. At the moment, MILRAA only handles non-scrambled IESs.
The recommended aligner is minimap2, with
the options --secondary=no --MD, with PacBio subreads/CLR reads (use option
-ax map-pb), or PacBio CCS/HiFi reads (use option -ax asm20) or Nanopore
long reads (use option ax map-ont).
Input data
- Ciliate MAC genome assembly, Fasta format.
- Long read library mapping onto that assembly, sorted/indexed BAM format; mapper should report valid CIGAR string and NM tag.
Differences of long read to short read alignments
MILRAA is analogous to the MIRAA module in the ParTIES pipeline that was originally designed to work with Illumina short read data. The original ParTIES MIRAA uses an initial Bowtie2 mapping step (local mode) and looks for breakpoints in the alignment, which are identified as insert (I), soft clip (S), or hard clip (H) operations from the CIGAR string of the SAM record.
The insert size for Illumina paired end libraries is typically 300-400 bp, so on average each read pair would span at most one IES. Most read pairs are unlikely to span a complete IES nor contain the entire IES sequence. In comparison, a long read with lengths 10 kbp or more may span multiple IESs, and the entire IES sequence can potentially be read out form the sequence.
Therefore, MILRAA has the following differences to MIRAA:
- Each read potentially covers multiple indels, unlike MIRAA which considers one read as support for at most one IES.
- Reads are not paired, so “insert size” is not an issue, and the entire insert sequence can be extracted from the reads.
- However, the error rate of long reads, even HiFi/CCS reads, is expected to be higher, so extracted insert sequences are aligned to get a consensus IES sequence, and a minimum indel length is required for IES calling (because many short indels are expected from sequencing error).
Pointers and TA junctions
IESs can be bounded by TA junctions or pointers (tandem repeats). One copy of the pointer or TA is excised with the IES, while another copy remains on the macronuclear destined sequence (MDS).
MILRAA uses the following conventions for coordinates, although they may not correspond to the way that the physical bases are excised in the actual DNA molecule:
- The coordinate of an IES junction (i.e. IES has been excised from the reference genome) is to the left of a pointer or TA sequence in the reference genome.
- The coordinate of an IES region (i.e. IES is retained in the reference genome) is to the left of the first pointer or TA sequence. The leftmost pointer/TA is considered the IES copy, and the rightmost pointer/TA as the MDS copy.
The coordinates reported in the start and end columns of the MILRAA GFF3
output are the coordinates based on the insert/deletion operations reported by
the mapper. However, if an indel is flanked by tandem repeats, there is
ambiguity as to where the “true” indel is, because it is not possible to tell
from the sequence alone where in the repeated sequence the physical cut
occurred.
For example, consider the following sequence containing an IES (upper case)
surrounded by MDS (lower case), the junctions are indicated with the pipe
character |:
gcgc|TAATGGTGCC|taatccgc (MDS + IES)

gcgc|----------|taatccgc (MDS only)

----|TAATGGTGCC|-------- (IES inferred sequence)
Notice the pointer sequence TAAT repeated in the left side in the IES, and to
the right of the junction in the MDS.
The first sequence (MDS + IES), when mapped onto the MDS sequence, would have
the CIGAR string 4M10I8M.
However, it is also possible to map it another way, with the CIGAR string
8M10I4M. The TAAT sequence now lies on the right side in the IES, and to
the left of the junction in the MDS. The MDS + IES and MDS-only sequences have
not changed, only our decision of where to place the junction of the inferred
indel.
gcgctaat|GGTGCCTAAT|ccgc (MDS + IES)

gcgctaat|----------|ccgc (MDS only)

--------|GGTGCCTAAT|---- (IES inferred sequence)
Because the insert is flanked by the repeated pointer sequence, alternative
mappings of 5M10I7M, 6M10I6M, and 7M10I5M are also possible. To deal with
this ambiguity, MILRAA does the following:
- If the putative IES indel, as reported by the mapper’s original output, is flanked by repeats, these are reported as putative pointer sequences, along with the original indel coordinates from the mapper.
- If the mapper reports the indel with the pointer/TA on the right side in the IES region, then the coordinates are adjusted so that it lies in the left side in the IES.
- If the putative pointer contains a “TA” sequence, this is reported as a possible TA junction, and the adjusted coordinates for this TA junction are reported.
- If it is possible to extend the repeats on their left sides to be longer than what the mapper reports, then the longest possible repeat (pointer) is reported, as well as the corresponding adjusted coordinates.
The pointer sequences and adjusted coordinates are reported in the attributes
field of the MILRAA GFF3 file, as described below.
Subreads vs CCS reads
PacBio sequence data is typically reported as “subreads” (see PacBio SMRT primer). Briefly, subreads in PacBio sequencing correspond to individual passes of a DNA molecule in a zero-mode waveguide (ZMW), where the sequencing adapters have already been removed from the sequence. Because a single molecule in a ZMW can undergo multiple sequencing passes, it can be represented by more than one subread in the sequencing data. For improving sequence quality, multiple passes are advantageous: the multiple subreads from a single ZMW can be used to generate a consensus sequence with higher accuracy than individual subreads, known as circular consensus sequencing, or CCS.
CCS reads are typically highly accurate (errors less than 1%), compared to subreads which can have error rates of 5-15%. However, to generate CCS reads, the sequencing depth of a library must be relatively high.
Subreads and CCS reads are handled differently by MILRAA to predict the
positions of indels. This is chosen with the option --type subreads (default)
or --type ccs respectively. The experimental ccs mode has been tested with
PacBio HiFi Sequel II and may not work well with CCS reads from earlier PacBio
generations with slightly higher error rates. subreads mode should work with
CCS reads too.
Uncorrected Nanopore reads should also be run with --type subreads mode.
Diagram of MILRAA workflow for CCS reads vs. subreads:
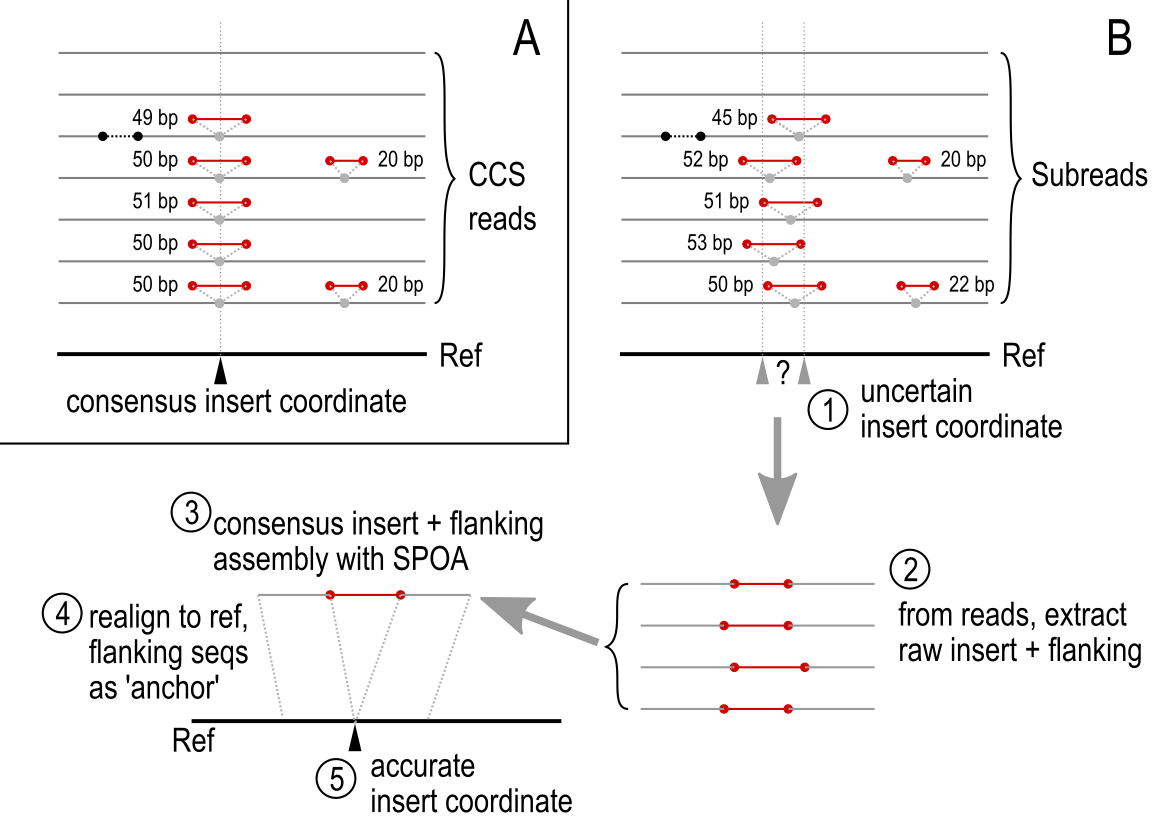
IES junction position and consensus sequence
With subreads, the error rate is high enough that the insert position reported by the mapper may not be accurate. Therefore, from the list of insert coordinates reported by the mapper (inserts above a minimum length threshold), clusters of insert coordinates which are no more than 2 bp from each other are extracted. If the number of insert-containing subreads in a cluster is above the coverage minimum, these are further processed to get the consensus sequence of the insert. The insert sequence and a flanking region of the mapped reads are extracted and aligned to get a consensus sequence, using SPOA. This insert+flanking consensus is then aligned with the corresponding region on the reference sequence. The flanking sequence helps to “anchor” the consensus in the reference, so that we can extract a more accurate insert coordinate. If this adjusted coordinate is more than 5 bp away from the original coordinates, an error is reported; this may represent inserts where the flanking regions on some reads are not homologous to the reference, e.g. from mapping of paralogs or from sequencing errors.
With CCS reads, the insert position reported by the mapper is assumed to be accurate. The insert sequence from an individual CCS read is also assumed to be accurate. However, even with CCS sequences the error rate is high enough that individual insert sequences at the same coordinate may vary from each other, including by indels. The higher the coverage, the more variants will be expected. Furthermore there is also the possibility that a site may experience alternative excisions, where the sequences excised may be of different lengths: see the section “Fuzzy IES length matching” below.
Read coverage
Because the number of subreads produced can differ substantially between ZMWs, it is preferable to count the physical molecules, represented by the individual ZMWs, rather than the subreads, to represent the read coverage. This information is parsed from the read names in the mapping file, which are assumed to follow PacBio convention. Therefore if the reads have been renamed, e.g. in a file downloaded from NCBI SRA, the subread vs. ZMW coverage reported will not be correct.
For CCS reads, each CCS read originates from a single ZMW, so the CCS coverage is used directly as the read coverage.
Fuzzy IES length matching (CCS mode)
The default mode for CCS read mappings is “strict”, i.e. to define a given IES junction, all the insert operations at a given coordinate must have the same length. However, this does not account for sequencing errors that may introduce indels, nor the possibility of different excised sequences at the same coordinate.
With the --fuzzy_ies option, insert sequences (putative IES sequences) at a
given coordinate are extracted from the mapped reads. These are pairwise
aligned and clustered by sequence identity. The clusters are then split at a
identity threshold given by the --cluster_dist option (default 0.05, i.e.
5%). Clusters are then used to define an IES junction if they meet the minimum
coverage threshold. The consensus IES sequence is produced from a multiple
sequence alignment (with Muscle) of the cluster members. Gaps are reported in
the output Fasta file (with the - character), but gaps are ignored when
predicting a pointer sequence.
Potential limitations of MILRAA
- Scrambled IESs are not supported. Depending on the software, these are likely to be reported by the mapper as clips in the alignment.
- Accurate mapping is assumed. Mismappings may result in misprediction of IESs. These can be caused by long repetitive elements in the genome, e.g. paralogs, mobile elements, and genome duplication events. Repeat annotation on the reference assembly is recommended. IES predictions that fall within repetitive regions should be treated with caution.
- Long IESs (longer than average read length) are less likely to be predicted and assembled, because MILRAA only considers reads that completely span potential IESs. Therefore, retention scores for long IESs will potentially also be underestimated.
Output
MILRAA produces the following output files by default ({OUT} is the output
filename prefix, supplied with the --out option):
{OUT}.milraa_ies.gff3{OUT}.milraa_ies.fasta
With the --fuzzy_ies option, the following additional outputs are produced:
{OUT}.milraa_ies_fuzzy.gff3{OUT}.milraa_ies_fuzzy.fasta
With the --dump option, internal data is dumped in JSON format for
troubleshooting to:
{OUT}.milraa.dump.json
MILRAA GFF3 output
The main output from MILRAA is a GFF3 file, with MILRAA in the source column
(column 2).
Putative IES junctions are reported where a minimum number of reads (threshold
defined by the --min_break_coverage option) contain an insert relative to the
reference assembly. In the GFF3 file, these are reported with
internal_eliminated_sequence_junction in the type column (column 3).
Junctions are features with zero length on the sequence; in GFF3 convention the
end coordinate (column 5) will equal the start coordinate (column 4), and
the junction is located to the right of that location coordinate.
Putative IES sequences are reported where a minimum number of reads (threshold
defined by the --min_del_coverage option) contain a deletion relative to the
reference assembly. In the GFF3 file, these are reported with
internal_eliminated_sequence in the type column.
IES retention score
The score column (column 6) reports the provisional IES retention score for
that putative IES feature. The IES retention score is defined as IES+ / (IES+ +
IES-) where IES+ is the number of IES+ reads and IES- the number of IES-
reads for a given IES feature, in the mapped reads.
For subread mappings, the ZMW coverage is used to calculate the score, not the subread coverage. For CCS reads, each read corresponds to one ZMW so the CCS read coverage is used directly.
Attributes column
In addition, the attributes column (column 9) reports more information that is
relevant to IES analysis. Attributes are formatted as tag=value pairs,
delimited by semicolons ;.
ID- Unique identifier for each IES reportedIES_length- Length of a given IES. If the--fuzzy_iesmode is used, and inserts of different lengths are used to define this IES, then the modal length is reported. If there is a tie between multiple values, then all tied values are reported, separated by underscore_character.cigar- Summary of CIGAR operations that support a given reported IES. For example, if an IES junction is reported on the basis of 20 reads containing a 28 bp insert at that location, this is reported as28I*20. If--fuzzy_iesmode is used, and different operation lengths support a given reported IES, these are separated by space characters.average_coverage- Total number of reads mapping to these coordinates. Only reported if input is a sorted, indexed BAM file.pointer_seq- Possible pointer sequence, based on the mapped coordinates, if present. See above for discussion on pointer calling.ta_pointer_seq- Pointer sequence starting withTA, if present.ta_pointer_start,ta_pointer_end- Adjusted start and end coordinates relative to a TA boundary, if present.pp_pointer_seq- Maximized pointer length, if present.pp_pointer_start,pp_pointer_end- Adjusted start and end coordinates relative to a maximized pointer, if present.
The following fields are reported when the mapping data are from subreads, i.e.
with the option --type subread:
IES_subread_coverage- Number of subreads mapping to this location containing the IES.IES_zmw_coverage- Number of ZMWs mapping to this location containing the IES.average_subread_coverage- Total number of subreads mapping to this location.average_zmw_coverage- Total number of ZMWs mapping to this location.
The output GFF3 file from MILRAA can be used to plot graphical summary of
predicted IESs with the script milraa_plot.py.
MILRAA Fasta output
The Fasta file contains the consensus IES sequences, with headers corresponding
to the ID field in the GFF3 file.